

Local Booking Manager can show various Chart statistics according to filter selected
How to create a Chart statistics report
To create the Cash Register Report you need to access your Local Booking Manager and click and select
1. Reports
2. Chart statistics
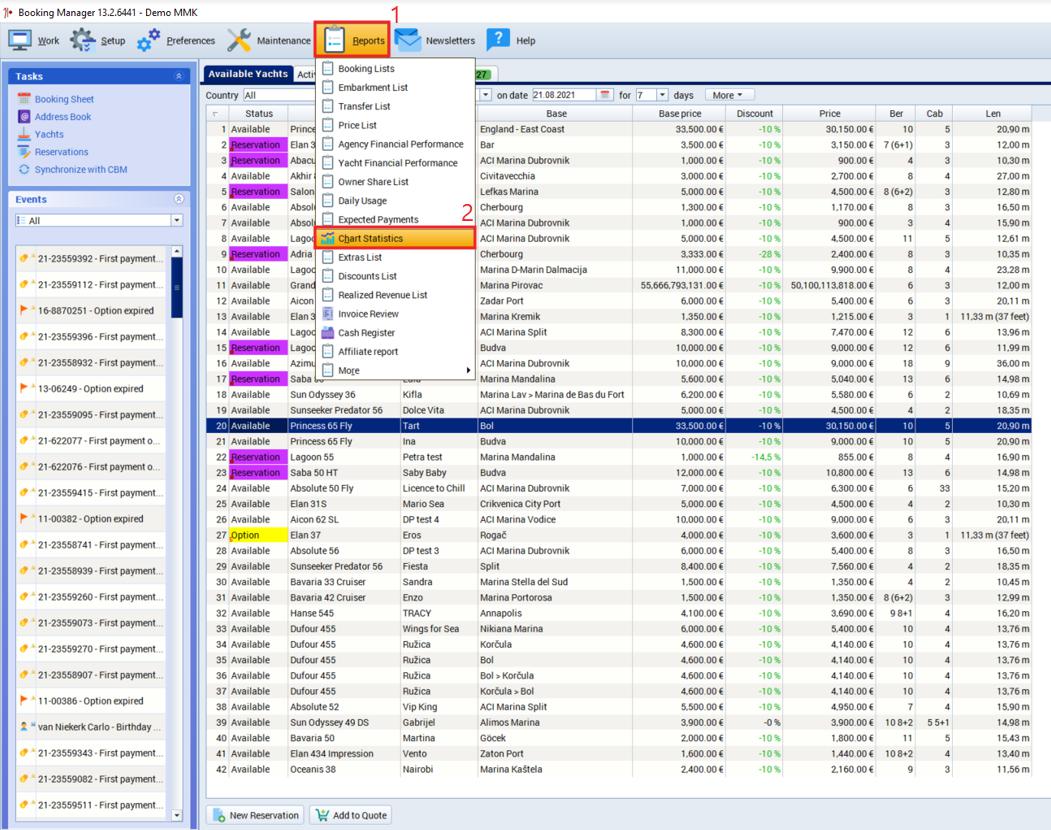
The report can be created by various filters, choose between:
1. Type-between countries, for each country
2. Year
3. Granularity- to select the report by week, month, quarter or Year
4. Show- by Total income, Booked days, Discounts amount, Total extras, Extras payable in base, Base price, Owner part, Charter pack
5. By- Sailing period or Booking period
6. Show- all countries or between first top 30
7. Show total value
8. Show in currency
After you've selected desired criteria, click on
9- Refresh
If you want to store it locally on your PC select
10- Save
For example, if you want to see a chart report for discount percentage increase/decrease for the year 2021.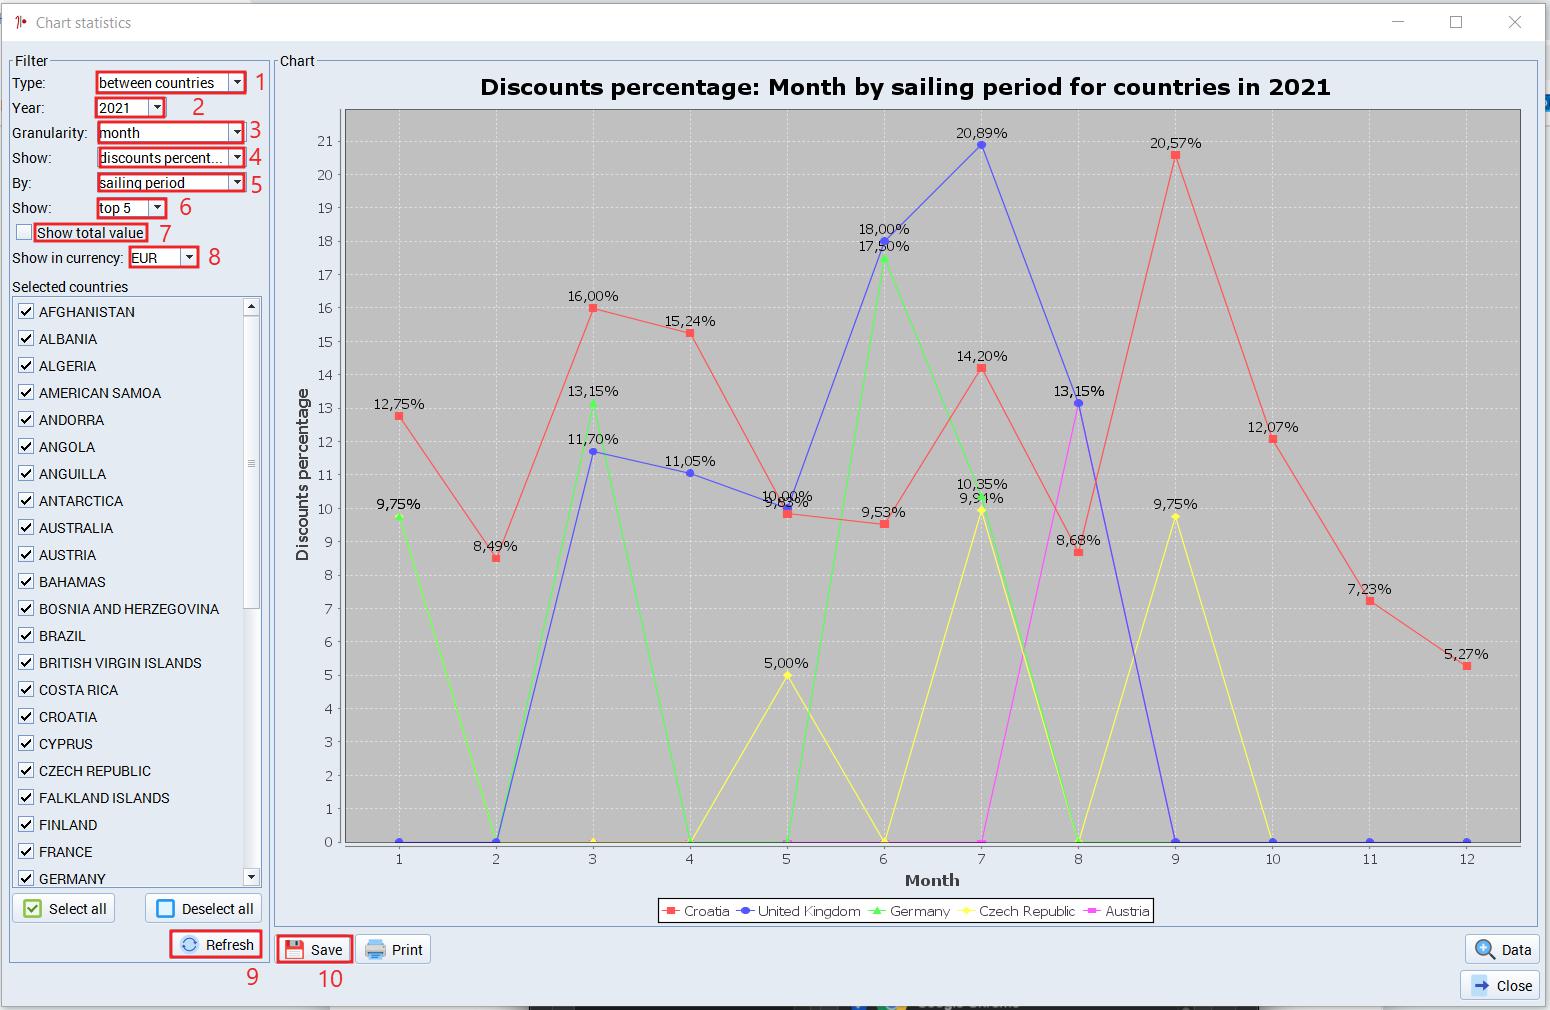
How to export Chart statistics report
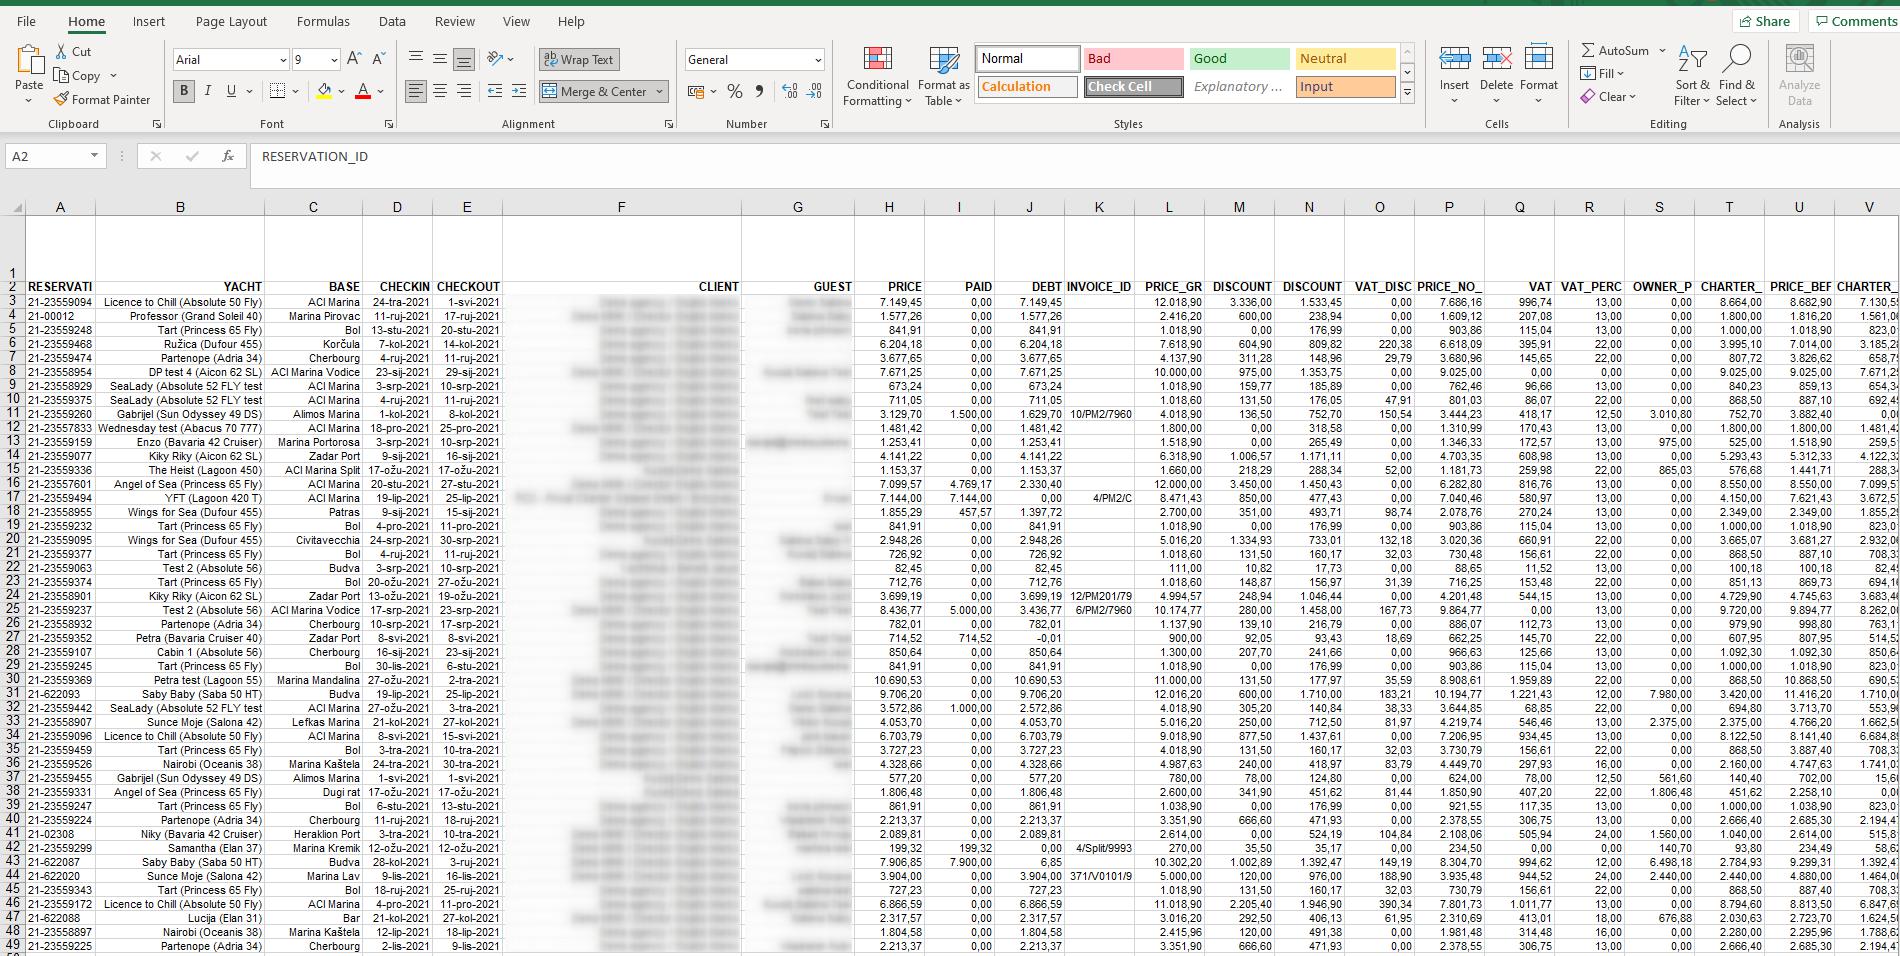
If you want to see data in a table and export it to Excell, go to
1- Data
2- Export
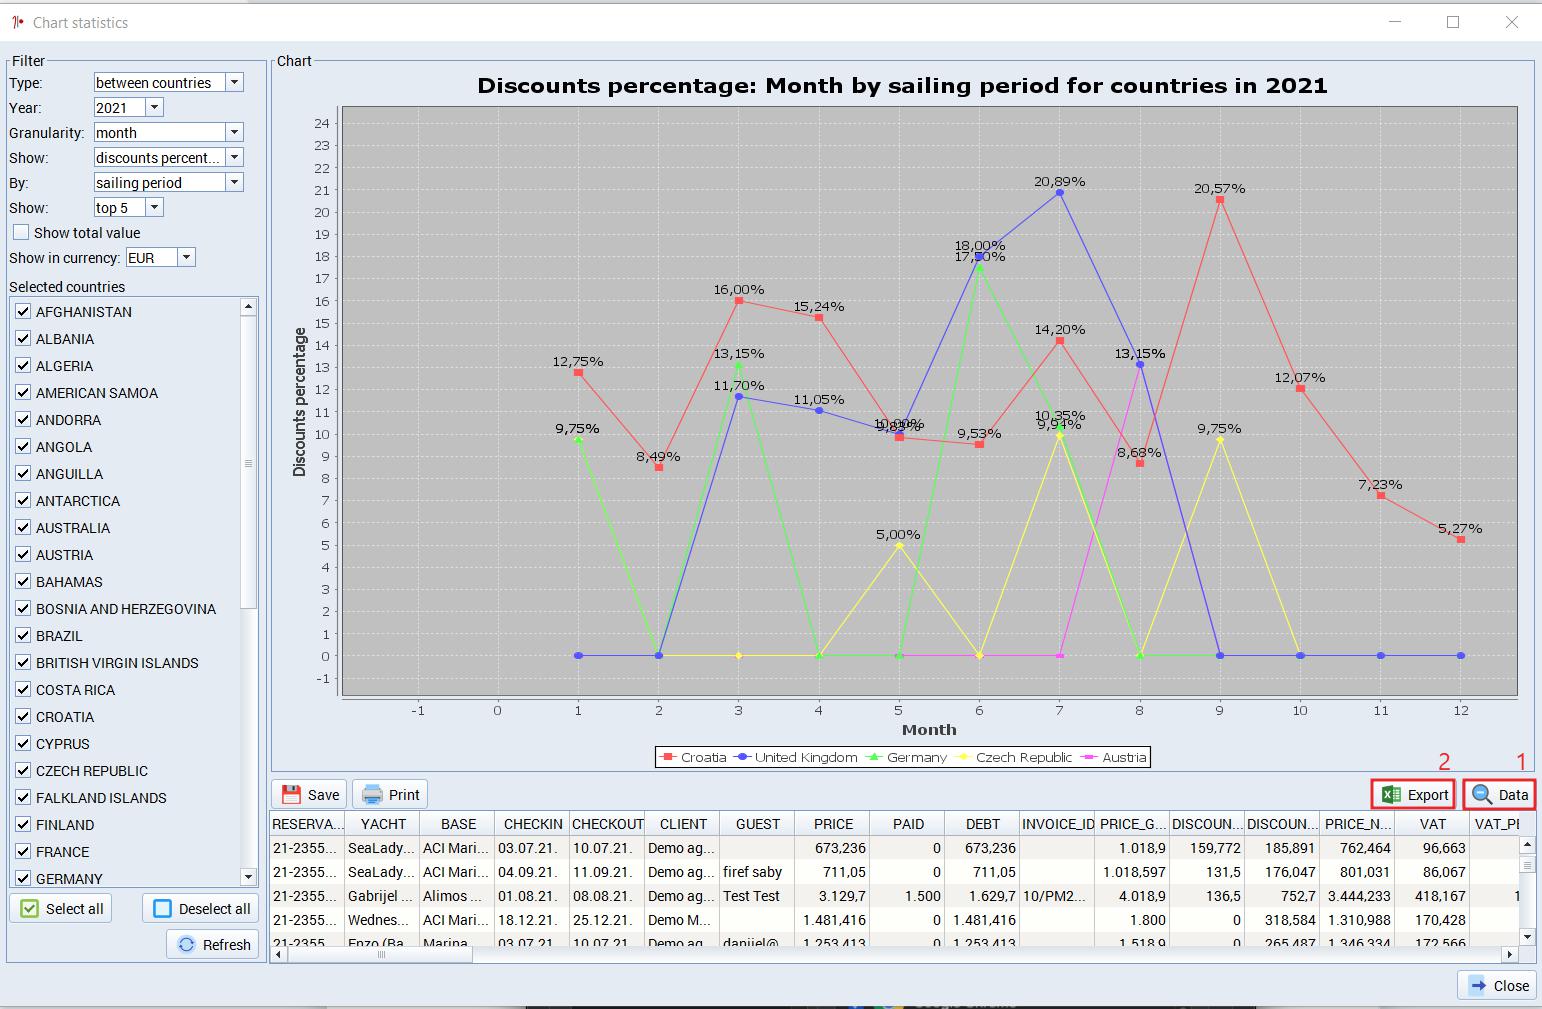
3- The export wizard will open, select the location where you want to store it
After you've stored the report, open it
Comments
0 comments
Please sign in to leave a comment.